,
An analog sensor delivers much more information than a switched digital sensor. Analog sensors have a voltage output range similar to digital sensors (usually around 0 to 5 volts). However, unlike digital sensors, analog sensors can read everything in between their min and max voltages. These types of sensors are very useful when you want to see how a logged channel changes in your car as it goes around the track. These sensors can tell you a lot about what is going on with the car, and for this reason, they are more often used for logging than switched digital sensors. This is why racing data loggers tend to have more analog channels than digital channels. Typically, these sensors have three wires, although there are exceptions. The table below gives a few examples of analog sensors and their data logging use.
Example uses for Analog Sensors | |
Sensor Type | Logging Use |
Suspension Potentiometers | Basic use would be measuring suspension travel through a run. More advanced uses are: evaluating aerodynamic loading, evaluating damper valving and spring rates, measuring weight transfer, measuring vehicle roll, etc. |
Differential Pressure Sensors | Very useful for evaluating vehicle aerodynamics and designs of ducting |
Fluid Temperature Sensor | Useful when evaluating heat exchangers such as intercoolers, trans temp coolers, differential coolers, and engine oil coolers. Also useful for evaluating powertrain issues. |
Throttle Position Sensor (TPS) | Useful for evaluating the driver's throttle work, as well as evaluations of vehicle weight transfer and changes in tire loading due to acceleration. Also good for pinpointing issues with the engine. |
Brake/Clutch Pressure Sensor | Useful for seeing how much load the driver is applying to the brake/clutch pedal. Also useful for pinpointing issues with both. |
Brake/Clutch Travel Sensor | Useful for seeing how much pedal travel the brakes and clutch take for engagement, as well as seeing how much pedal travel the driver is applying. |
Load Cells/ strain gauges | A precise way to measure aero loading on the car. |
IR Temp Sensor | An expensive sensor, but can be used to read tire temps throughout a run. Used effectively, these can be powerful tools for tire tuning decisions. |
Steering Angle Sensor | Useful to see a driver's steering inputs. Couple this with brake/clutch travel and pressure sensors, TPS, engine rpm, GPS, and accelerometer data to evaluate driver. |
Common Trait: All these sensors measure how something changes. There are numerous types of analog sensors out there, and the data received from them is powerful. Typically you'll always wish you had more logging channels to measure more analog sensors. | |
The fact that the AQ1 can read 8 analog sensors is really impressive considering its price point. Typically, you want as many analog sensor channels as you can get, and at this price range, most data loggers will have less than 8 (if any!) analog sensor inputs.
Logging Speed: Up to 1,000 hz per Channel
Just as important as the number of sensors a data logger can read, is the rate at which it can read them at. The AQ-1 is capable of reading a sensor up to 1000 times a second (1000 Hz) on each of its sensor channels. As far as logging rates go, this is very fast. Certain things such as temperature change slowly, so you can usually log at a lower rate, like 5 to 10 times a second (5-10 hz). On the other end of the scale, you have sensors that have rapid changes, such as suspension potentiometers. For sensors such as this, you will want to read at higher rates of around 200 hz or more (we read our racecar's suspension shock pots at 500 hz). For rapidly changing sensors such as suspension potentiometers, high logging rates will allow you to see very subtle effects that you wouldn’t see at lower logging rates. On the negative side, reading at high rates sometimes makes the data hard to read and uses a lot of memory.
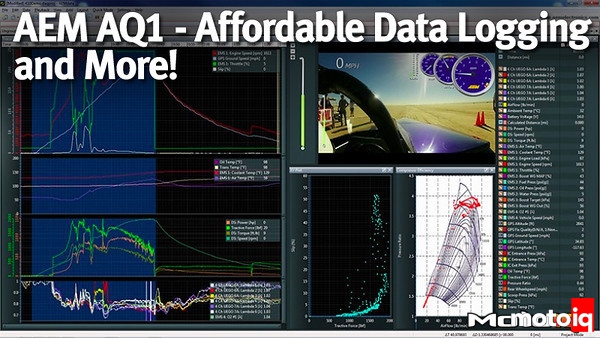
The beauty of the AQ-1 is that you can choose between several different logging rates, which is much more useful than being stuck with one logging rate. Figures 1.1.A and 1.1.B show a trace of GPS ground speed logged at 10 Hz and dynamic pressure logged at 50 Hz. Dynamic pressure can be converted to speed based on certain assumptions, and is used to look at airspeed while the car is moving. You’ll notice that both curves look similar, although the dynamic pressure curve is not as smooth as the GPS curve. This is due to the fact that there are simply more data points on the dynamic pressure curve in comparison to the GPS curve, which is seen in Figure 1.1.B. Shown in Figure 1.1.B, are the same data traces as in Figure 1.1.A, just zoomed up closely. Although the dynamic pressure curve appears more “noisy” than the GPS ground speed curve, it can also show us changes that happen quickly and momentarily- something that a data trace logged at a lower rate would not be able to show us. The AQ-1 also allows you to set alarm parameters for logged channels so when a value exceeds your maximum defined input it will be highlighted in the log trace.


A cool feature on the AQ1 is that data is stored on an SD card. AEM supplies a 2 GB card with the AQ1, but this can be expanded by replacing it with a larger sized SD card. For teams that run for long periods of time logging at high rates, this might be a necessity.
Serial/GPS Connectability
Serial refers to a type of communication that is used to transmit data between two devices. The AQ1 can connect to serial devices such as its older Series 1 and 2 ECUs and GPS Transponders. Personally, I think that this port should be used for connecting with a GPS Transponder. Another option for adding GPS would be to use AEM’s recently released Vehicle Dynamics Module. This module adds GPS/GLONASS, a 3-axis accelerometer and 3-axis gyrometer for collecting chassis data like pitch, and roll and yaw. This device connects to the AQ-1 through a DTM connector via AEMnet- AEM's CANbus connection.
A GPS transponder collects position data of a vehicle from satellites as it moves across the earth’s surface. GPS data allows you to create track maps, which you can use in your data analysis. Basically by adding a track map, the AEMData software can then tell you where on the track and on which lap a certain sensor reading occurred. Figure 1.2 shows an example of this, where we were looking at wheel loading and load distribution as the car went along the Big Willow track. Adding GPS maps really helps with the data analysis process and is a very powerful feature that is a must have on any data logger.