,


Above we have the fluid temperature data for Lap 2 during our session at Big Willow. In the previous years we have had issues with engine temperatures, and engine cooling was a huge priority for the 2016 season on the car. Large exposed radiator area to the air, and efficient exit vents on the hood were emphasized in order to improve cooling performance. Starting the season in 2016 we found that the cooling system that had been developed worked far better than expected. We had a hard time getting the engine coolant to reach high temperatures during cooler track sessions at the beginning of the year. Consider that the temp data above came from a track day in August, where ambient air temperatures were well over 100 degrees Fahrenheit. The front ducting on the car to the radiator came at the expense of front downforce. Given the performance of the engine cooling system, we feel that we might be able to decrease the inlet area to the radiator a bit to allow us to gain some more front downforce on the car.
In this section we looked how data is used by Paul, our tuner, to evaluate changes for the car’s powertrain setup. Data is often invaluable at not only pointing out severe issues, but also aiding with complex decisions. For any team, racing budgets are not infinite, and often purchases and development time need to be prioritized. Data plays a crucial role here in being able to evaluate which monetary and time investments will give the greatest returns for the team. In the long run, the investment of data logger pays itself many times over by limiting wasted development time and money.
Using data from the aerodynamicist’s perspective:
Finally on to my favorite topic: Aerodynamics! In nearly all forms of motor racing, aerodynamics plays a huge role in the overall performance of the vehicle. The goals and targets for aerodynamic design of vehicles varies depending on the objective, but usually the overall design approach remains the same. It is well known that top levels of motorsport spend large amount of resources on vehicle aerodynamic evaluation and design. At the amateur levels most teams don’t have the resources to spend on aerodynamic development like the pros do, however, that does not mean it is impossible.
As I constantly tell people, the most important aspect of aerodynamic development is not the design itself, but rather the process on how that design was created. Aerodynamics tuning and development is often seen as a black art. In reality, however, aerodynamic design is just really an exercise in the scientific method. There are three categories of experimental techniques that are used to study vehicle aerodynamics: real world track testing, controlled environment testing (wind tunnel, water tunnel, etc.), and computer simulation. At Jager Racing we use a combination of track testing and computer simulation to develop our car.
Since we are limited in knowledge, computer hardware, and scanning tools, our computer simulations are fairly basic. We do tests on simplified geometries, such as the image below, to study global trends. We will then study a few concepts before we then go and build something to put on the car. We then use data collected from the track, along with Mark’s feedback on the vehicle handling to evaluate our design decisions and compare them to the data from our simplified models.

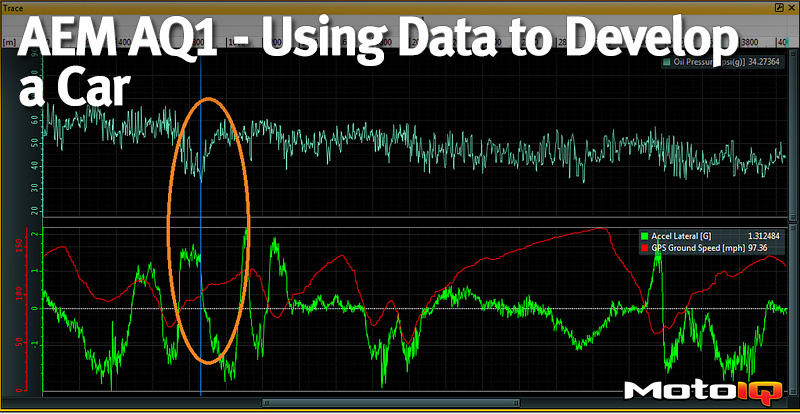
For this reason, track side data is very important to us. Without it, we would not be able to investigate the effects of aerodynamic changes to overall performance of the car. When we first began our formal aerodynamics development program for the car, we knew that a data logger would be the most important investment for the car. As we’ll get into in Section 3 of this series, we log a few different sensors that we use to investigate the behavior of the car. For aerodynamics work we currently log: vehicle ride height, air speed, ground speed, lateral acceleration, and longitudinal acceleration. Between March and August of 2016 we rolled out a huge change to the vehicle aerodynamics package. We were fortunate enough to have driven the car at Big Willow both times to have a chance to evaluate the differences.

Above we have a comparison between the two fastest laps of our time in August (main lap) and our time in March (secondary lap). The areas circled in blue are areas where we noticed the greatest amount of difference in cornering speed, namely on turns 2, 8, and 9 which make sense since they are high speed turns. Next we're going to show a close up of the data through turn 2, and a close up of data through turn 8 and 9.