,
 The analysis page shows you total lap time, best lap time, theoretical best time, max peak speed, minimum speed, and average speed. As well as total time difference between laps and section time differential. (not shown in this screen shot)
 By pressing the “Play” button in the upper right hand corner, you can watch a replay of your whole lap as the dot on the track map which represents you, travels the length of the course according to the data from your laps on course. The speed chart at the bottom makes it easy to decipher where you gained and lost time. Above we have a test day hot lap from the Novak Racing Subaru GC once again this time on Buttonwillow Raceway Park's infamous “Clockwise #13” track configuration. Which is the SoCal time attack community bench mark.
 Here is a good visual comparing lap telemetry data between two seperate cars during two different run sessions from the same day, on the same track. The slightly faster lap represents Project 370Z, while the slower lap is Project Mustang GT. The speed chart helps to clearly show the difference in cornering speed, brake zone timing/distance, throttle application on corner exits, as well as peak speeds reached on the straights. Using the “play” button feature will have the two dots “race” each other around the track for an accurate visual of the pace difference around the entire course.
Products like the LT-Q6000 from Qstarz brings professional levels of data acquisition and telemetry at a modest price, with a user friendly interface ultimately elevating the driving level of the grassroots crowd for years to come.
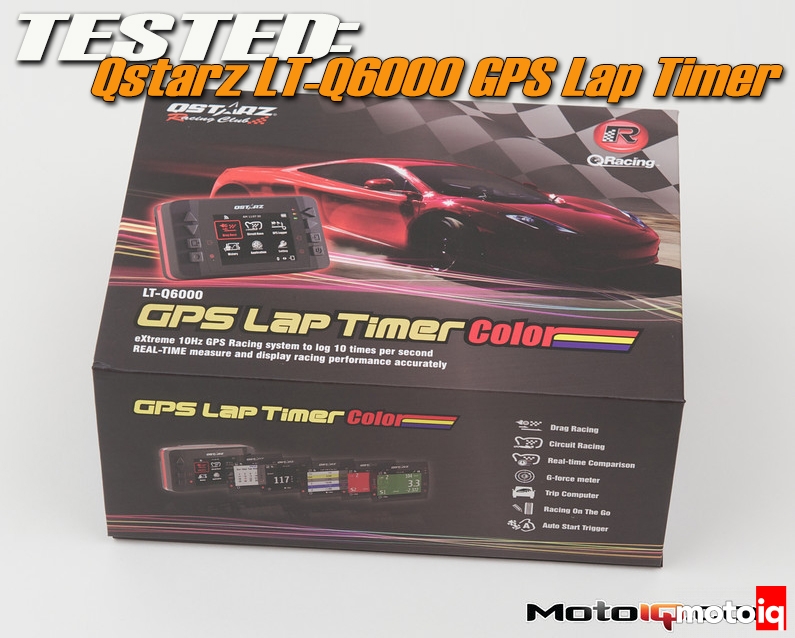
Unit function and capability
eXtreme 10Hz Log to record 10 times per second
Real-time perform and display Lap Timing analysis
2.4” True color and wide display to illustrate racing data precisely
Real time Lap/Spilt/Sector Comparison
Multi-Function Device – Lap Timer and GPS Logger
Start-Run by Push-and-Go, Timer, or Auto Trigger
Diversified Drag Race modes selected by speed/distance and kph/mph
Flexible Circuit Race selected by Lap with splits or Simple Lap
Performance Test On-the-Go
2GB Large memory capacity never worry full memory
History database well organized as Calendar and table type for easy review
Flexible Track Manager – On-Device created to User track, and QRacing
Sync to Shared track
G-force meter to plot G-force status
Smart speedometer to show real-time speed information
Device configurable such as unit, backlight, brightness, time zone, or time format
Support On-Device Export to KML, CSV or GPX files
Unit hardware
Adopt MTK II chipset with high sensitivity -165dBm and 66-Channel tracking
2.4” (320×240) TFT Color display with 65K color
Ultra lower power consumption up to 10hrs operation (under LCD backlight on)
Log rate up to 10Hz excellent for High speed Racing (*1)Including 8 Function buttons – 4 Direction Buttons (Up/Down/Left/Right) / Back, Enter, Multi-function, and Power Buttons3 LED Indicators – Green for Screen Power Saving, Orange for Charging, and Red for Alert
Built-in G-sensor for G-force measurement and Auto Start trigger
Built-in 4GB large memory inside (X)
Device recognized as USB removable disk for data access with computer conveniently
Raise beeper function to notice some status of device
IPX-3 water resistance
Less than 15-Sec. AGPS fix support to realize faster TTFF and positioning under warm start
Mini-USB interface for charging, data download and firmware updateFirmware upgradable
Device Dimension: (LxWxH): 100 x 59 x 28mm
Device Weight: 107 grams (Mounting bracket excluded)
SOURCES


