
,
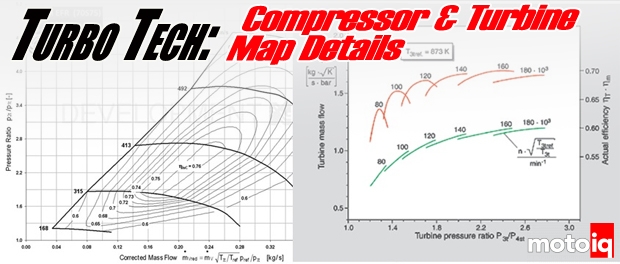
The housing A/R and the compressor wheel to turbine wheel match affect efficiency by altering a parameter known as the Blade Speed Ratio, U/Co. U is the blade tip speed and Co (called C naught) is basically the speed of the gas flow into the turbine wheel. Co is also known as the spouting velocity and is defined as that velocity which has a kinetic energy equal to the isentropic enthalpy drop from turbine inlet stagnation pressure to the final exhaust pressure; so for our purposes, it is basically the velocity of the gas into the turbine wheel. For the commonly used radial flow turbine wheel in turbochargers, a ratio of approximately 0.7 is ideal for maximum efficiency. As we discussed previously, the size of the turbine housing A/R changes the gas velocity (Co) and therefore changes the efficiency.
 |
| This plot shows corrected gas flow and the generalized efficiency curves for three different A/R turbine housings for the same turbocharger. In general, small A/R turbine housings have low efficiency at the lower flows and pressure ratio levels with higher efficiency at the higher flows and pressure ratios. Conversely, large A/R turbine housings generally have their peak efficiency at lower flow rates and pressure ratios. Do not read anything into the relative peaks of the curves I plotted for the different sized A/R sizes; it is all very wheel and housing design dependent and there is no way to generalize which size housing will have the highest peak efficiency. |
The optimal range of turbine housing A/R sizing depends on the size of the turbine wheel. For example, a Garrett GT1548 with a 41.2mm diameter turbine wheel comes with a 0.35 A/R housing. A GT2860RS has options of 0.64 or 0.82 A/R housings for its 53.9mm diameter wheel. The 82.0mm diameter turbine wheel in a GT42 has a range of turbine housings from 1.01 A/R to 1.44 A/R. As you can see, smaller wheels need a smaller A/R and larger wheels need to go bigger.
The other mysterious player in turbine efficiency is the compressor wheel on the other end of the shaft. As we now know, there is an optimal speed for the turbine wheel for a given velocity of gas flow trying to go through it. However, the speed of a turbocharger is determined by the compressor side and the airflow demands of the engine. In general, the larger the diameter of the compressor wheel, the more mass flow of air it will push for a given compressor speed.
 |
| Here we have the point of 50 lbs/min air flow and a pressure ratio of 2.5 plotted on compressor maps for the GTX3071 and GT3582. At this point, the GTX 71mm compressor wheel is spinning at about 125,000rpm whereas the GT 82mm compressor wheel is spinning about 100,000rpm. |
What happens if we put the 82mm compressor wheel of the GT35 onto the 60mm turbine wheel of the GT30? If we pretend that the GTX3071 is at the ideal U/Co ratio of 0.7 at the point plotted on the compressor maps, then the turbo with the 82mm compressor wheel is spinning 25,000rpm slower. This of course means the same 60mm turbine wheel is spinning 25,000rpm slower reducing U. The lower U results in a lower and less optimal value of U/Co reducing turbine efficiency; lower turbine efficiency results in more sluggish response. With this knowledge of the relationship between compressor wheel sizing and turbine efficiency, we can examine the case of the GTX3071 versus the GT3076.
 |
| The maps above show the 71mm diameter compressor wheel of the GTX3071 flowing about the same as the 76mm compressor wheel of the older GT3076. As mentioned earlier, the smaller diameter wheel must spin faster to achieve the same mass flow rate and pressure ratio. At the point of 50 lbs/min and 2.5 PR, the 71mm wheel spins about 125,000rpm versus about 120,000rpm for the 76mm wheel. |
Though the GTX3071 compressor flows about the same as the regular GT3076, it requires a higher compressor speed to do so. In general, many turbos have a value of U/Co that is lower than the ideal 0.7. In this case, replacing the 76mm compressor wheel with the equal flowing 71mm GTX wheel increases the turbine tip speed. The increased turbine speed increases the U in Blade Speed Ratio, U/Co, bringing it closer to the ideal and improving turbine efficiency. The increased turbine efficiency combined with the lower mass and inertia 71mm GTX wheel makes the GTX3071 more responsive than the regular GT3076.
Compressor and turbine maps have many details that go into them. They have to use corrected values in order to be comparable much like how engine dyno results are all corrected to a SAE standard. A full turbine map shows very important information relating turbine mass flow rate, pressure ratio, and efficiency to each speed line of the compressor. These three characteristics of a turbine can be affected by a number of variables with turbine housing A/R sizing being the primary variable that an end-user can alter; different A/R sizes can be tested to find the best combination of power and drivability for a particular application. The other parameter that a user can decide on is the compressor to turbine wheel sizing. Altering the size of the compressor wheel versus the turbine wheel alters the blade speed ratio affecting turbine efficiency and responsiveness of the turbocharger. All this information from turbine maps really aids the selection of the proper turbocharger for an application. Hopefully, the turbine map is now a bit less mysterious and the concepts of A/R size selection and wheel matching is clearer.
Sources

7 comments
Using the compressor map and engine specs, is there a way to calculate or estimate what the boost threshold will be for a turbo?
Yup, and more critically, the turbine map. I did an example here.
https://motoiq.com/turbo-tech-calculating-turbocharger-compressor-and-turbine-performance-advantage-with-the-new-honeywell-garrett-gtx-gen2/
You can do it easier with the Borg Warner Matchbot app online. There are many assumptions you will have to make if you don’t have real world data for your engine. And the biggest assumption is the turbine efficiency to use during spool-up. It’s all guesswork on the pulse effect which effectively increases turbine efficiency. A twin-scroll setup will have a much stronger pulse effect which is why they spool up turbos more quickly.
Assuming better turbine efficiency translates into more work being put into the shaft as torque to spin the compressor, how does a smaller a/r turbine housing produce better efficiency at higher flows and pressure ratios and a larger one better at lower flows and pressures. I always ran smaller a/r housings for spool and low boost set ups and bigger a/r housings for more boost at high rpm and flows with less backpressure.
I must be missing something in the charts but ive read it several times over. Great article
Good question and beyond my knowledge. Definitely some complex fluid flow stuff going on! On the second page with my plot of big and small A/Rs and their flow and PR curves for the same shaft speed, those are basically same shaft power curves. Turbine shaft power is a function of mass flow, PR, and efficiency. Pretending the efficiencies are the same, the big A/R uses higher mass flow to generate the shaft power and the small A/R uses higher pressure ratio.
The perfect A/R is where it is sized perfectly to generate the shaft power required and not wastegate any flow. This can be done on an application like a power generator set that runs at a constant speed and load all the time. Flow that is wastegated is basically like negative turbine efficiency. The more you have to wastegate, the more it basically brings down your effective turbine efficiency. Of course, if you actually want to have a wide powerband and be able to spool up at low rpms, you have to run a lower A/R and then wastegate the excess at the higher power levels.
Your turbine housing sizing strategy is not a bad one. With a low boost setup, that implies a low power target, so you don’t need a big A/R to keep the exhaust manifold pressure down. To generalize turbine housing sizing, run the smallest A/R that you can and still be able to hit the power target. The type of application does matter though. One that does a quick pull and sees minimal time at high turbine pressure ratio can get away with a smaller A/R and subject the engine to higher exhaust back pressure. But something like a road course race car, or gen set, that speeds all of its time at peak power, the goal would be to minimize exhaust back pressure. A street car that needs a lot of low-end torque for stop light action can have the turbine housings sized where the exhaust manifold pressure is one bar higher than the intake manifold pressure; so and engine delta pressure of negative one bar. For a road course car, one would want engine dP as positive as possible at peak power, while still having a broad enough powerband. It’s made easier these days with race transmissions that can keep the engine rpms high keeping a big A/R turbo in the range it stay spooled. And with new e-turbos, the turbine housing A/R can be made bigger because the integrated electric motor adds the shaft power when the exhaust flow is not enough.
Interesting article, thanks.
I’m confused by turbine maps showing mass flow plateau at a given PR. Does running at greater PR increase absolute turbine output or can it actually hinder it? I’ve seen a case where the addition of a second wastegate reduced back pressure considerably while increasing boost pressure at the same conditions.
Thank you.
The turbine maps show a corrected turbine mass flow. Corrected turbine mass flow is a function of actual mass flow divided by turbine pressure ratio. It’s typical to see the corrected turbine mass flow actually decrease at high turbine pressure ratios. That’s an indication the turbine pressure ratio is increasing faster than the actual turbine mass flow, so not a good thing.
Thank you very, very, much.